Last Updated on 3 years by Sachin G
Analyze boot up performance on CentOS 7 , RHEL 7 , Fedora and Ubuntu
[box]
Now in most of latest Linux distribution Systemd is default init-system and having lots of new features . systemd basically designed for boot up performance.
Now through systemd tool system-analyse we can see execution tree of systemd and analyse systemd status data. This will help in investigate of failure and the boot procedure was stuck on some unit you would have the capacity to pinpoint the estimated area for your more profound examination.
Here I am showing four basic interesting commands to look boot performance .
(1) Systemd-analyze
(2) systemd-analyze blame
(3) systemd-analyze critical-chain
(4) systemd-analyze plot
[/box]
1.systemd-analyze
[box]
systemd-analyze that will show timing insights about the boot procedures . To check the amount of time was spent in user and kernel space on boot , run below command :
# systemd-analyze
OUTPUT :
Startup finished in 1.189s (kernel) + 2.012s (initrd) + 10.425s (userspace) = 13.626s

[/box]
2.systemd-analyze blame:
This will show list of all running units, requested when they took to introduce.This data may be utilized to streamline boot-up times . This output may be misdirecting as the start up of one service load slow because it wait for other service to complete initialize.
# systemd-analyze blame
3.systemd-analyze critical-chain
[box]
To analyse in which units critical points in the start up run the below command, Mine for example:
The time after the unit is active or started is printed after the "@" character.
The time the unit takes to start is printed after the "+" character.

multi-user.target @10.406s
└─mariadb.service @5.187s +5.215s
└─network.target @4.885s
└─network.service @1.763s +3.108s
└─basic.target @1.748s
└─paths.target @1.738s
└─brandbot.path @1.738s
└─sysinit.target @1.670s
└─systemd-update-utmp.service @1.615s +52ms
└─auditd.service @1.458s +137ms
└─systemd-tmpfiles-setup.service @1.414s +36ms
└─rhel-import-state.service @1.340s +68ms
└─local-fs.target @1.332s
└─local-fs-pre.target @1.329s
└─systemd-tmpfiles-setup-dev.service @1.034s +287ms
└─kmod-static-nodes.service @900ms +127ms
└─systemd-journald.socket
└─-.mount
└─system.slice
└─-.slice
[/box]
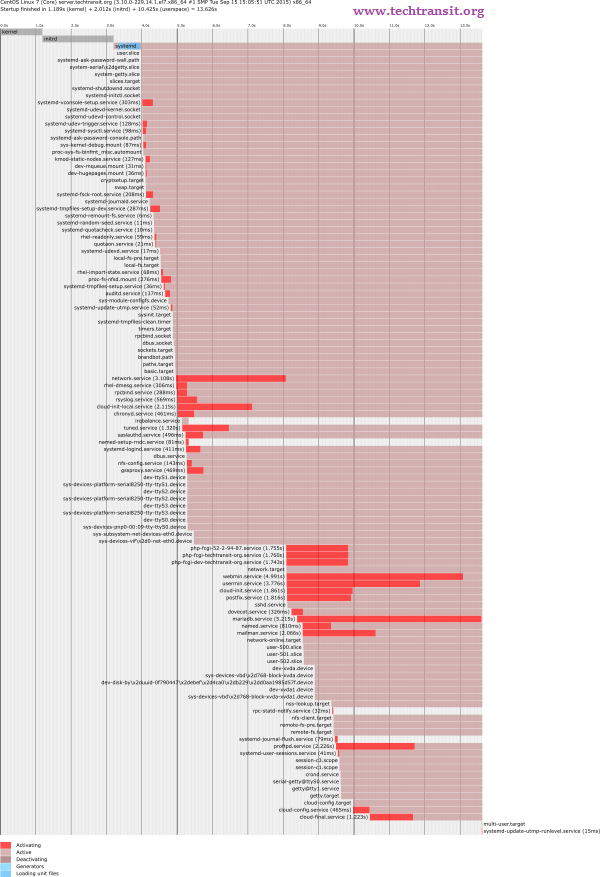
4.systemd-analyze plot :
For graphical representation we can create a svg plot graph which will indicate graphical units.
#systemd-analyze plot > techtransit.svg
Image of SVG ploted graph
[box]
Hope you enjoy the post , for any concern please comment here 🙂
[/box]

I am a professional freelance contributor and the founder of Tech Transit. I hold certifications in Linux, Ansible, and OpenShift from Red Hat, as well as CPanel and ITIL certifications. With a passion for education, culture, and community, I love writing and sharing knowledge. Since 2009, I’ve been actively using, setting up, supporting, and maintaining Linux systems. Linux truly rocks!


