
Last Updated on 3 weeks by Sachin G
Have you ever wondered why your Linux machine sometimes takes forever to boot, while other times it starts up in seconds? Slow boot times can be frustrating, especially when you’re troubleshooting production servers or working on performance tuning. Fortunately, modern Linux distributions come with a powerful tool called systemd-analyze that helps you examine, measure, and troubleshoot boot-up performance.
In this post, I’ll share how to diagnose and optimize your Linux system’s boot performance using systemd-analyze. We’ll explore essential commands like systemd-analyze time, systemd-analyze blame, and systemd-analyze critical-chain to identify bottlenecks, measure startup delays, and improve overall boot efficiency.
I’ve personally used these commands on Ubuntu, CentOS, RHEL, and Fedora systems to troubleshoot slow startup issues. The results were eye-opening because they provided clear, actionable data rather than leaving me guessing.
Why Analyze Boot Performance in Linux?
Before we dive into commands, let’s answer an important question: Why bother analyzing boot performance?
- Identify Bottlenecks: Slow boots often occur due to a specific service hanging during startup.
- Optimize Boot Time: Understanding delays helps you fine-tune your system.
- Improve Reliability: Troubleshooting boot issues reduces downtime and frustration.
- Performance Benchmarking: Measuring boot time gives you a baseline before and after changes.
Now, let’s jump into the step-by-step guide to measure boot performance on Linux using systemd-analyze.
What is systemd-analyze?
In most modern Linux distributions, systemd is the default init system responsible for managing services during startup. It also provides built-in tools for performance analysis, and systemd-analyze is one of the most important.
This command-line utility gives you detailed information about the system boot process, including:
- Total boot time (kernel + initrd + userspace)
- Which services take the longest to start
- Dependency chains that can delay other units
- A graphical SVG plot of the boot sequence
Supported Distributions
- Ubuntu (18.04, 20.04, 22.04, 24.04)
- CentOS / RHEL
- Fedora
- Debian
- SUSE Linux Enterprise
Understanding systemd-analyze and Boot Timing
Here I am showing four basic interesting commands to look at boot performance. This utility will work on CentOS, RHEL, Fedora, Ubuntu.
- Systemd-analyze
- systemd-analyze blame
- systemd-analyze critical-chain
- systemd-analyze plot
Step 1: Check Total Boot Time Using systemd-analyze
The simplest way to check Linux startup time using systemd-analyze is with the time option.
# systemd-analyze
Sample Output:
Startup finished in 1.189s (kernel) + 2.012s (initrd) + 10.425s (userspace) = 13.626s
What does this mean?
- Kernel: Time taken to load the Linux kernel
- initrd: Time taken by the initial RAM disk
- Userspace: Time taken by services and applications
This total boot time is useful for quick checks. For example, on my Fedora system, I noticed an unusually high userspace time, which hinted at service-level delays.
Real-World Example
On Ubuntu 22.04 workstation, the total boot time jumped from 9s to 25s after I installed a VPN client. Running systemd-analyze confirmed the spike was in the userspace segment, which led me to investigate further using the next command.
Step 2: Find Slow Services with systemd-analyze blame
This will show a list of all running units, along with when they were introduced. This data may be utilized to streamline boot-up times. This output may be misdirecting as the startup of one service load is slow because it waits for the other service to complete initialization.
This is where interpret systemd-analyze blame results becomes essential. The blame subcommand lists services in descending order of the time they took to initialize. I found that NetworkManager-wait-online.service was adding a whopping 18 seconds to my boot. After tweaking its timeout and disabling unnecessary network scripts, the boot time dropped dramatically.
# systemd-analyze blame
Sample Output:
18.233s NetworkManager-wait-online.service
 5.215s mariadb.service
 3.108s network.service
 2.421s plymouth-quit-wait.service
Why is this useful?
- It shows which services are taking the most time.
- In the above output,
NetworkManager-wait-online.servicedelayed the boot by 18 seconds.
My Experience
On one of my RHEL servers, the NetworkManager-wait-online.service was the culprit. Disabling it reduced boot time by 15 seconds instantly. This is why systemd-analyze blame is my go-to command for quick boot issue analysis.
Pro Tip: Do not disable services blindly. Research their purpose first, especially on production servers.
Step 3: Examine Dependencies with systemd-analyze critical-chain
Another powerful command is:
This shows a tree view of services and their dependencies. I often refer to this as a system boot profiler, showing which services are delaying others. It’s perfect when you want the systemd-analyze critical chain output explained visually. To analyse in which units critical points in the start-up run the command below, for example.
multi-user.target @10.406s
└─mariadb.service @5.187s +5.215s
└─network.target @4.885s
└─network.service @1.763s +3.108s
└─basic.target @1.748s
└─paths.target @1.738s
└─brandbot.path @1.738s
└─sysinit.target @1.670s
└─systemd-update-utmp.service @1.615s +52ms
└─auditd.service @1.458s +137ms
└─systemd-tmpfiles-setup.service @1.414s +36ms
└─rhel-import-state.service @1.340s +68ms
└─local-fs.target @1.332s
└─local-fs-pre.target @1.329s
└─systemd-tmpfiles-setup-dev.service @1.034s +287ms
└─kmod-static-nodes.service @900ms +127ms
└─systemd-journald.socket
└─-.mount
└─system.slice
└─-.slice
How to Interpret This?
multi-user.targetcompleted at 10.4s.mariadb.servicestarted at 5.1s and took 5.2s.- This shows which service delayed others due to dependencies.
Use Case: This is invaluable when two services appear slow in blame, but one is waiting on the other. It helps prioritize optimizations.
Learn Smarter. Level Up Faster →
Want to master Linux, DevOps, Ansible, or Cloud workflows the smart way? I’ve curated a list of top-rated, real-world Udemy courses — based on student reviews and practical feedback.
Visit the Recommended Courses page to explore and enroll in courses trusted by the community.
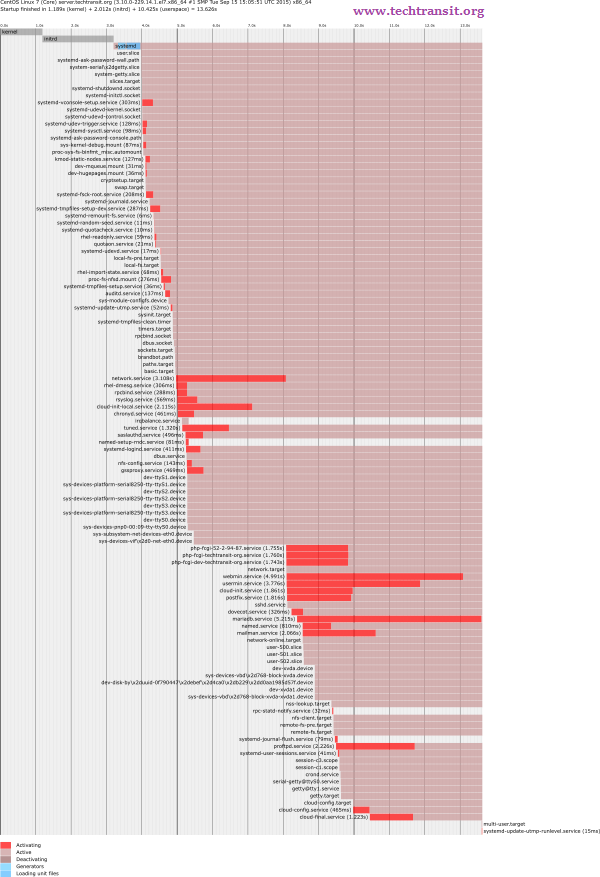
See Curated Courses →Step 4: Visualize Boot Process with systemd-analyze plot
You can generate an SVG file showing the entire boot process visually.
#systemd-analyze plot > techtransit.svgOpen boot-performance.svg in your browser. You’ll see a timeline where each bar represents a service and its startup duration.
Image of SVG ploted graph
Additional Commands and Tips
systemd-analyze dump→ Shows complete systemd state information.journalctl -b→ View logs for the current boot.- Remove unused services to reduce delays.
- Enable parallelization of services with
systemddefaults.
Best Practices for Linux Boot Optimization
- Keep your system updated.
- Disable unnecessary services using
systemctl disable <service>. - Optimize networking scripts for faster startup.
- Use SSD storage for significant improvement.
FAQ: Examine Boot-up Performance through systemd-analyze on Linux
Use systemd-analyze to check total boot time, systemd-analyze blame for slow services, and systemd-analyze critical-chain for dependency delays.
Yes, it works on most systemd-based distros like Ubuntu, RHEL, CentOS, Fedora, Debian, and SUSE.
Run systemd-analyze plot > output.svg and open the file in a browser.
Not always. Check the service purpose before disabling, especially in production.
Examining and improving boot-up performance in Linux doesn’t have to be guesswork. With systemd-analyze, you have a set of powerful commands that provide detailed insights into every stage of the boot process. Whether you’re a sysadmin troubleshooting delays or a Linux enthusiast optimizing your desktop, these tools are invaluable.
Take time to run these commands on your system today. You’ll be surprised at what’s slowing you down — and how quickly you can fix it.
Learn Smarter. Level Up Faster →
Want to master Linux, DevOps, Ansible, or Cloud workflows the smart way? I’ve curated a list of top-rated, real-world Udemy courses — based on student reviews and practical feedback.
Visit the Recommended Courses page to explore and enroll in courses trusted by the community.
See Curated Courses →
I’m Sachin Gupta — a freelance IT support specialist and founder of techtransit.org. I’m certified in Linux, Ansible, OpenShift (Red Hat), cPanel, and ITIL, with over 15 years of hands-on experience. I create beginner-friendly Linux tutorials, help with Ansible automation, and offer IT support on platforms like Upwork, Freelancer, and PeoplePerHour. Follow Tech Transit for practical tips, hosting guides, and real-world Linux expertise!